
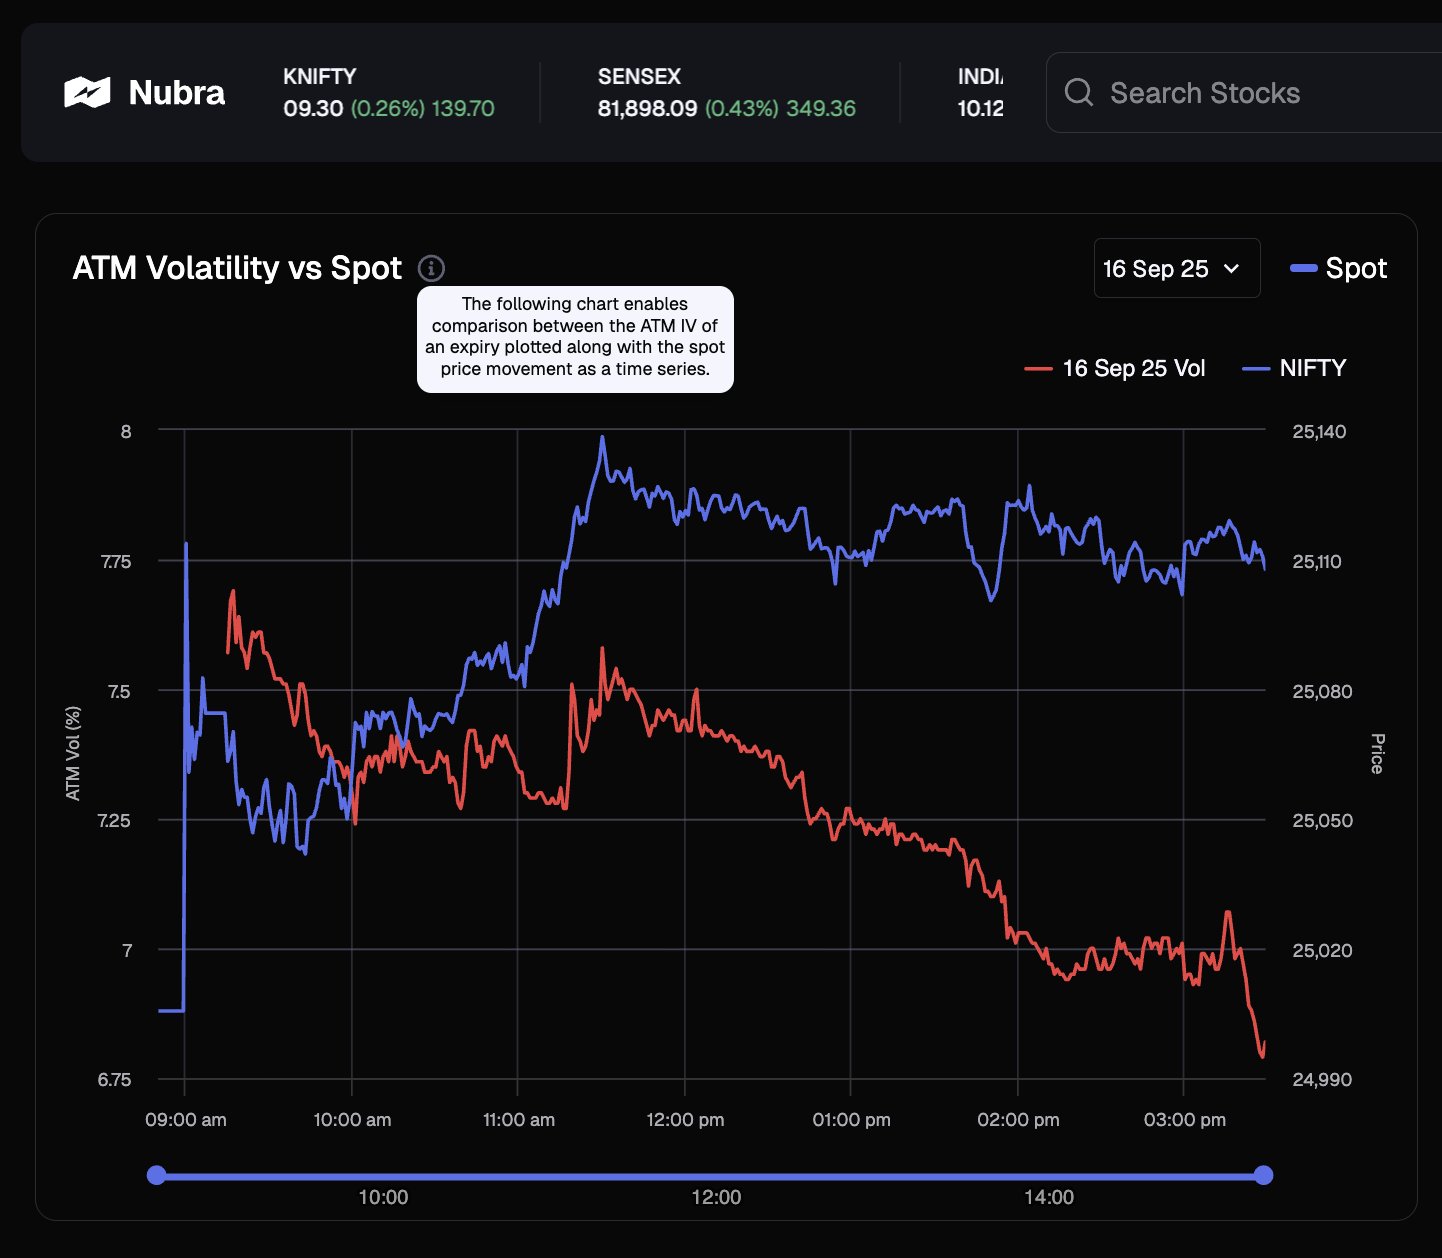
What does this Chart show?
A lot of you must have seen these advance charts but you might find them a little scary to interpret. Here' s a in-depth description of how useful these charts can be in your trading and how can one interpret it on Nubra.
Blue Line (Spot – NIFTY @ 25,100): Underlying index price.
Red Line (ATM IV – 7.75%): Implied volatility for ATM options expiring 16 Sep 25.
* Spot tells you: *where the market is right now.*
* IV tells you: *how nervous/relaxed option traders are about the future movement.*
If IV is high → traders expect bigger moves ahead (more uncertainty).
If IV is low → traders expect calmer moves ahead (more certainty).
So watching **how these two move together (or against each other)** gives clues about market psychology.
* Spot is relatively flat-to-slightly bullish after a morning ramp (25,060 → 25,120 → 25,100).
* ATM IV kept bleeding through the day (7.7% → 6.9%).
This tells us **option premium sellers are aggressively controlling the market**.
# Here's how you can interpret:
# 1. 9:00 – Market Opens
* **Spot (blue)**: sharp dip and then stabilizes around 25,100.
* **IV (red)**: starts high (\~7.6–7.7%) but immediately drops as price stabilizes.
**Trader’s read:** The market opened nervy (gap down), so IV was pumped up. But as price didn’t crash further, fear started calming down → IV dropped.
This is typical: IV spikes at open, then relaxes if no big moves follow.
# 2. 10:00 – 12:00 Noon
* **Spot**: Actually *rises* to \~25,140, strongest point of the day.
* **IV**: Keeps *falling* through this time, from \~7.4% to \~7.2%.
**Trader’s read:**
This is a “calm rally.” Prices are grinding higher, but nobody is scared. Traders are selling options (IV is dropping) because they believe the upside is controlled and not explosive.
Option sellers are comfortable here.
# 3. 12:00 – 1:00 PM
* **Spot**: Peaks then starts sliding down.
* **IV**: Still trending lower! (\~7.2% → \~7.0%).
**Trader’s read:**
This is interesting. Spot is falling, but IV isn’t rising. Normally when price falls, IV rises (fear). Here it doesn’t.
That tells you: the downmove isn’t scaring traders → they think it’s just profit-taking, not a panic selloff.
This lack of “fear spike” is a subtle bullish signal (weakness is being faded).
# 4. 1:00 – 3:30 PM (Close)
* **Spot**: Keeps sliding, ends near 25,000.
* **IV**: Falls even further, ending at \~6.9%.
**Trader’s read:**
Now both spot and IV are falling together.
That combination usually means:
* The market is drifting lower quietly.
* Traders are NOT paying up for protection (puts).
* Expectation: This is not the start of a crash, just a calm decline.
If it were the start of a bigger fall, IV would have spiked as people rushed to hedge.
# Key Takeaway:
* **Intraday context:** Spot stuck, IV collapsing.
* **Best use:** Sell ATM straddle (short premium), hedge deltas dynamically.
In simple terms think of **Spot = car’s speedometer**, and **IV = passenger’s fear level.**
* If car speeds up suddenly → passengers get nervous → IV jumps.
* If car is moving steadily at 60 km/h → passengers relax → IV falls.
* If the car slows down smoothly → no fear → IV keeps falling.
* But if car brakes hard → fear jumps → IV spikes.
That way you can spot the trend the market is making. Happy Trading!